ISSS608-VAA-Project
  • Home
  • Overview
  • User Guide
  • Poster
  • R Shiny App
  • Github
  • About

On this page

  • πŸ“’ Introduction
    • Background
    • Objective
  • πŸ“š Related Works
    • Steam Data Analysis by duerkos
    • Exploratory Data Analysis on Steam Store Games Dataset by Alden Yuan
  • πŸ“ Data
    • Data Source
    • Data Composition
  • πŸ“‹ Methodology
    • Packages
    • Visualizations
    • Storyboard Draft

Proposal: Exploring Trends in Video Games Distributed by Steam

Published

February 12, 2023

Modified

April 2, 2023

πŸ“’ Introduction

Background

In 2021, the video game market was estimated to be $195.65 billion and is expected to expand at a compound annual growth rate (CAGR) of 12.9% from 2022 to 2030. In comparison, One of the fastest growing categories is the digital PC games market which is estimated to grow from $10.86 billion in 2022 to $12.67 billion in 2023 at a compound annual growth rate (CAGR) of 16.7%. The COVID-19 pandemic contributed to the industry’s increased growth due to people being forced to remain indoors. This gave people the chance to explore more indoor activities, especially gaming. Several game developers also released their games for free online during this period.

Steam is a major digital game distribution platform run by the Valve Corporation. It was originally released in 2003 as a way for Valve release updates for their own developed games, but eventually evolved into a publisher for third-party games. The platform accounts for 75% of the global PC games market. In 2020, Steam had 120 million active users per month, averaging 62.6 million people use Steam every day. This growth resulted in the number of hours spent playing games on Steam climbing by 50.7% year over year, and game sales increased by nearly 21.4%.

Objective

The objective of the project is to visualize the historical and current field of the online PC games. Given that Steam already accounts for 75% of the PC games market, the dataset used will be focused on games in the Steam platform. We aim to achieve insights by exploring the relationships between demand, pricing, tags and reviews. This may be of help to any third party developers wanting to publish on Steam or anyone interested in investing into the video game industry to achieve an understanding.

πŸ“š Related Works

Steam Data Analysis by duerkos

This study focuses on the exploratory data analysis of game ratings or reviews and the different Steam tags such as genre, software requirements, themes and others. It also explores pricing trends and geographical factors. Our study can build on some directions provided by author the and further improve on the visualizations displayed.

Exploratory Data Analysis on Steam Store Games Dataset by Alden Yuan

This article delves into Steam store data in order to investigate on the quality of the games being released. It also explores the trends of popular games. This can provide inspiration in terms of visualization methods and also in terms of possible angles of exploration.

πŸ“ Data

Data Source

The data to be used was acquired from Kaggle updated last 2022. It is comprised of two datasets namely, steamspy_data.csv and steam_app_data.csv which will be used in this proposed study and Shiny app.

Data Composition

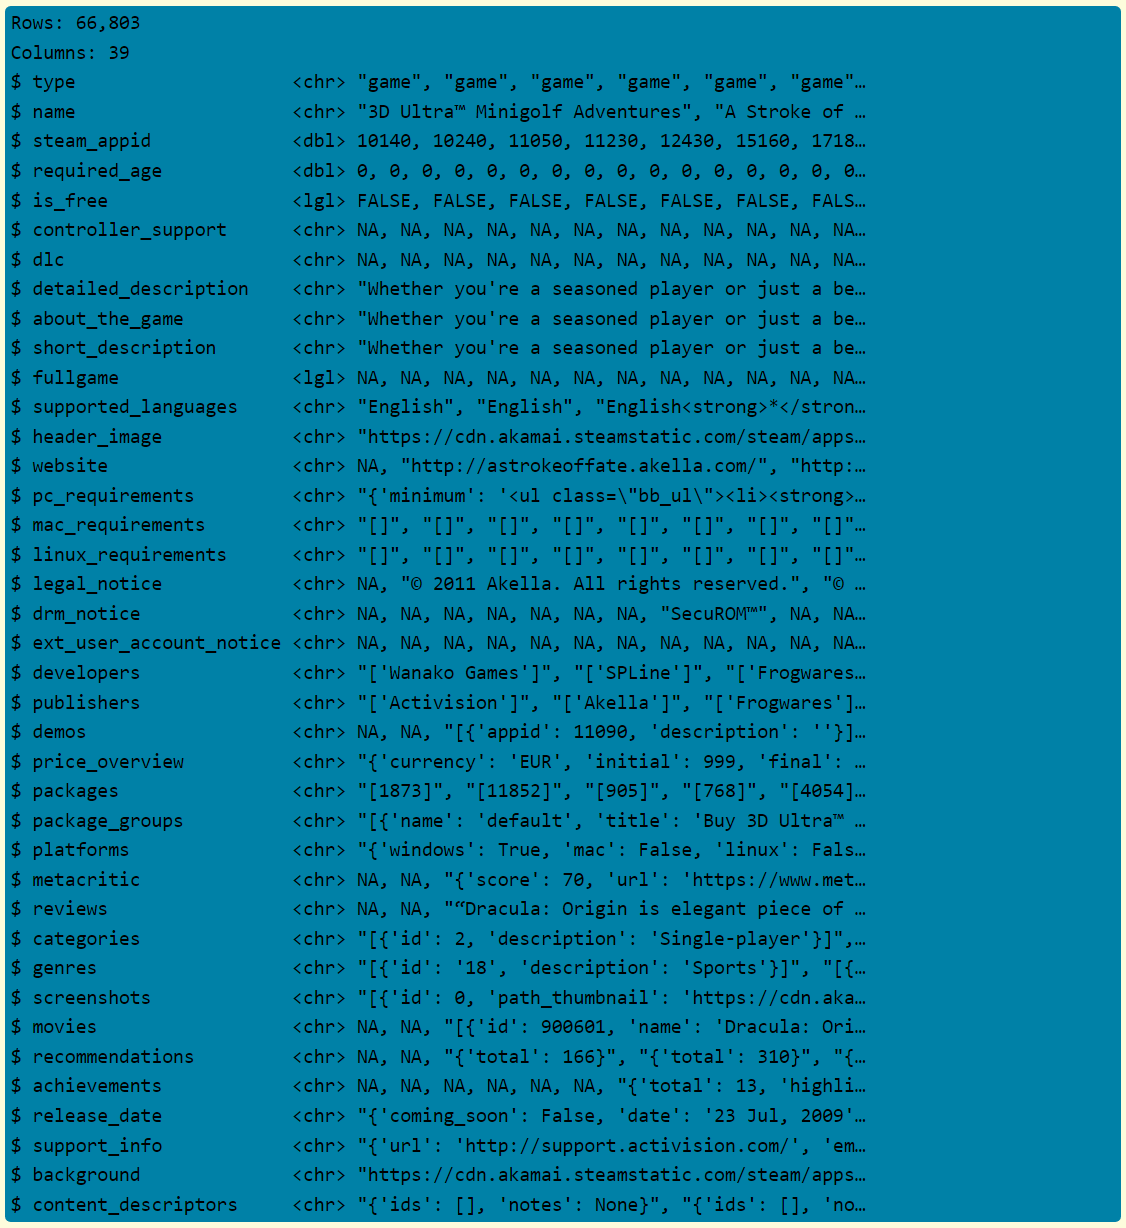
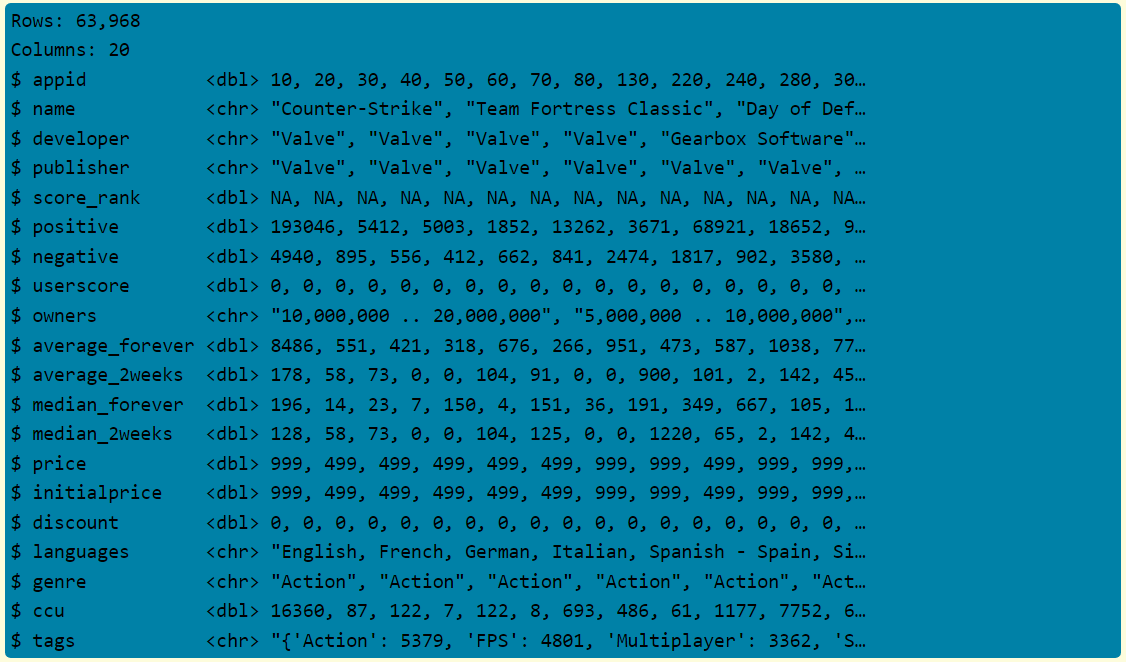
Using the glimpse() function of the dplyr package, the following figures contain the columns and sample values for the mentioned datasets.

steam_app_data.csv

steamspy_data.csv

πŸ–ŠοΈ NOTE!

The column information provided above are from the raw datasets. Further data wrangling and extraction will be performed in the process of the study and Shiny app creation. For example, the labels in the β€˜tags’ column need to be extracted from the its original string. Another thing to address is the all null values in several other columns.

πŸ“‹ Methodology

Packages

The following packages are required to perform the visualizations in the next section.

  • tidyverse - A collection of R packages designed for data science

  • ggtatsplot - An extension of ggplot2 package for creating graphics with details from statistical tests included in the plots

  • plotly - To build interactive graph

  • GGally – An extension to ggplot2 package by adding several functions to reduce the complexity of combining geoms with transformed data

  • ggdist - is an R package that provides a flexible set of ggplot2 geoms and stats designed especially for visualising distributions and uncertainty.

Visualizations

The following visual analytics methods will be applied for analysis in our study and Shiny app.

Descriptive Analysis

  • Interactive bar and histogram plots

  • Interactive combined line-scatter-box plot

  • Parallel coordinates plot

Statistical Analysis

  • Error bar plot

  • Interactive correlogram

  • ANOVA Test plot

Predictive Analysis

  • Linear regression plot with prediction interval

  • Regression plot (if time permits)
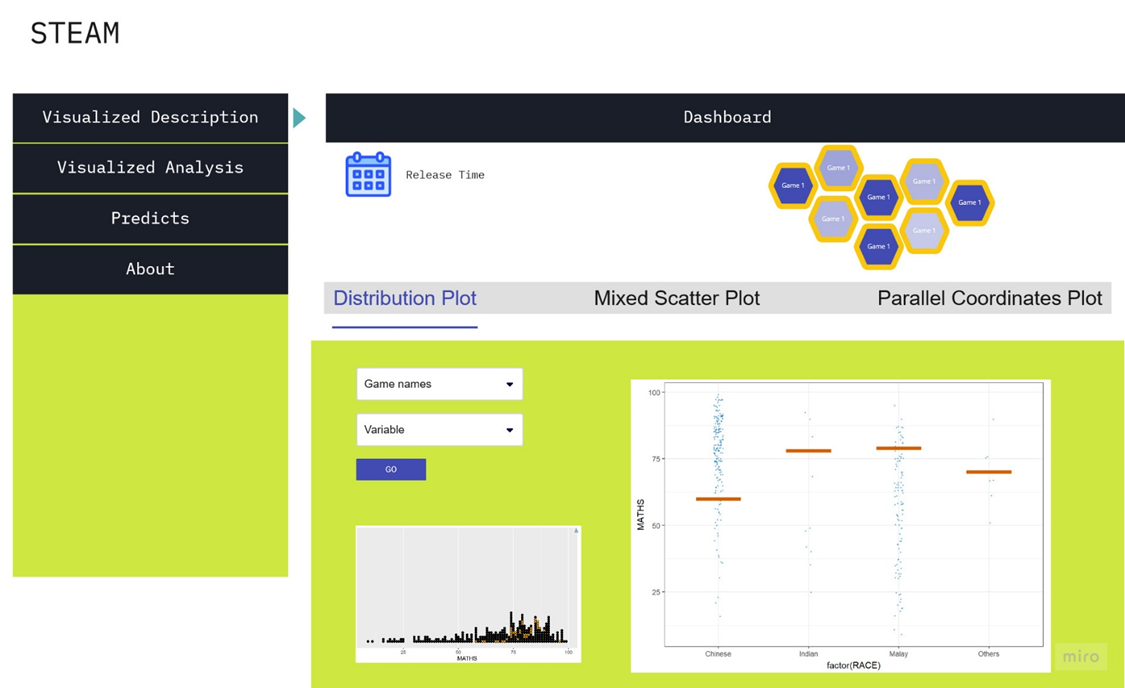
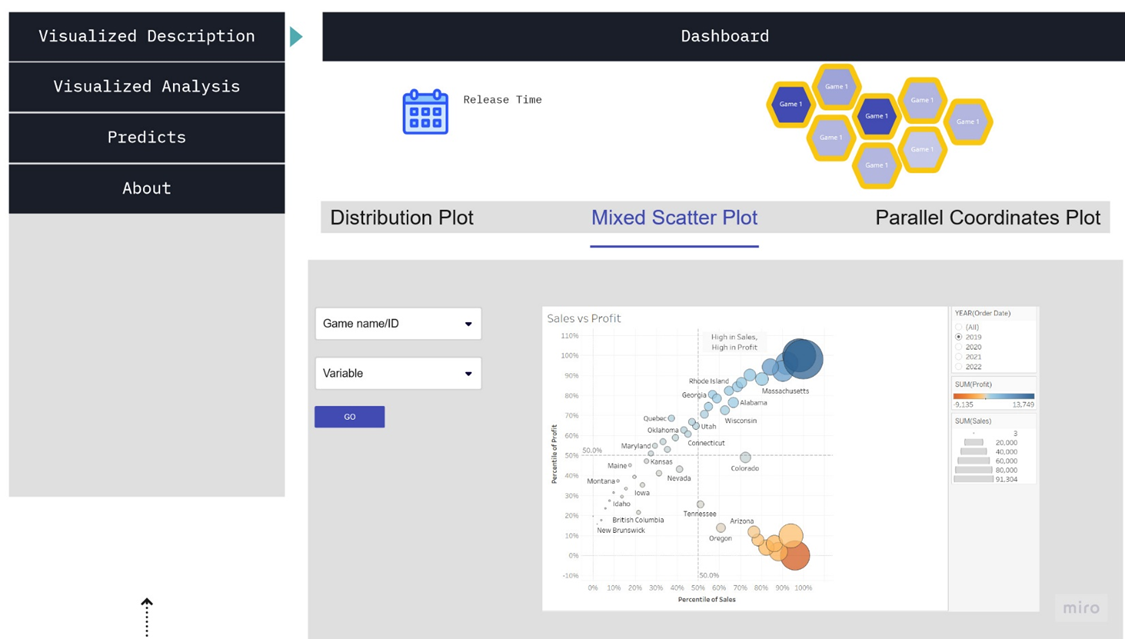
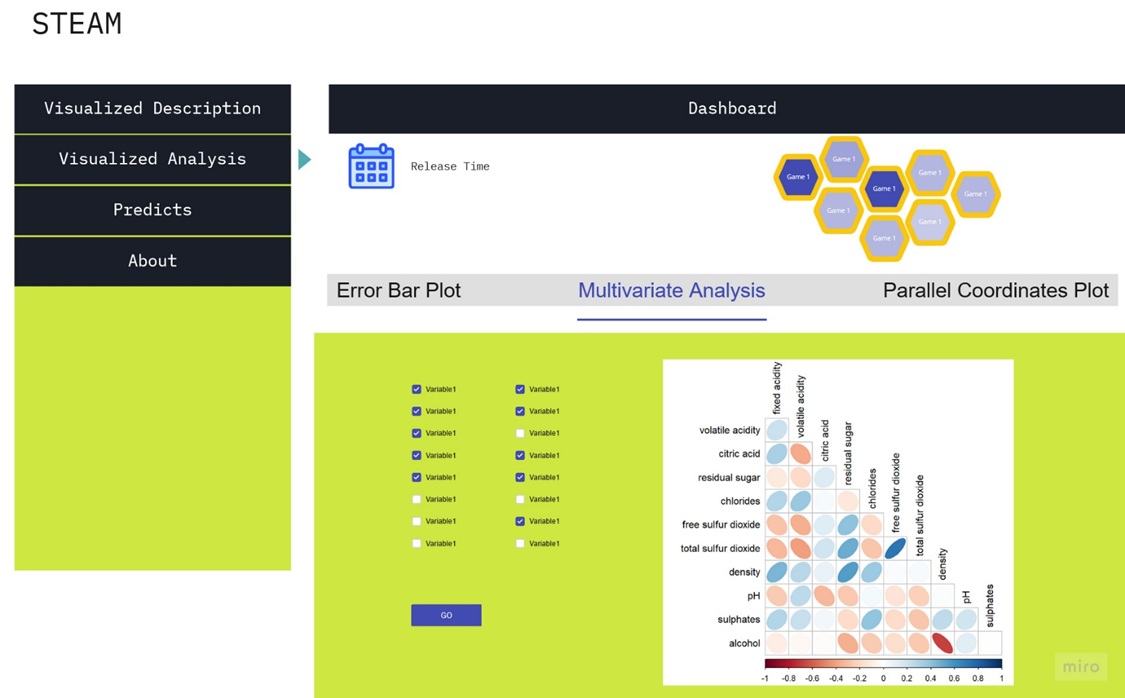
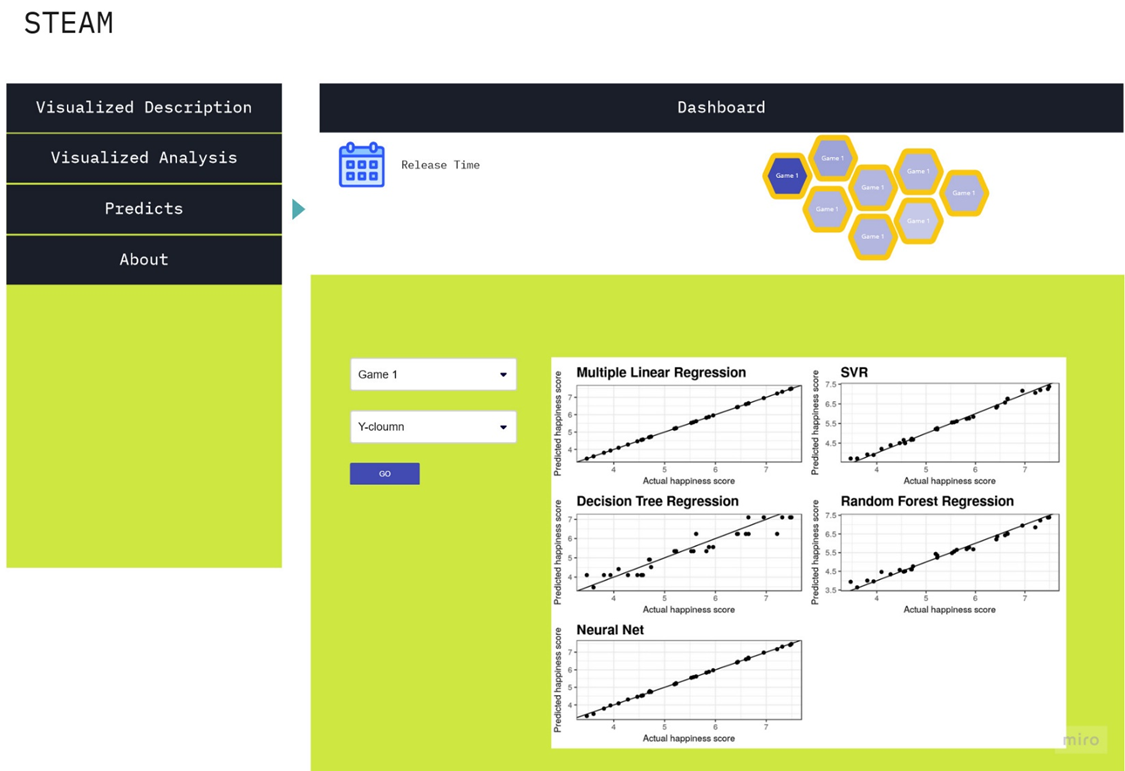
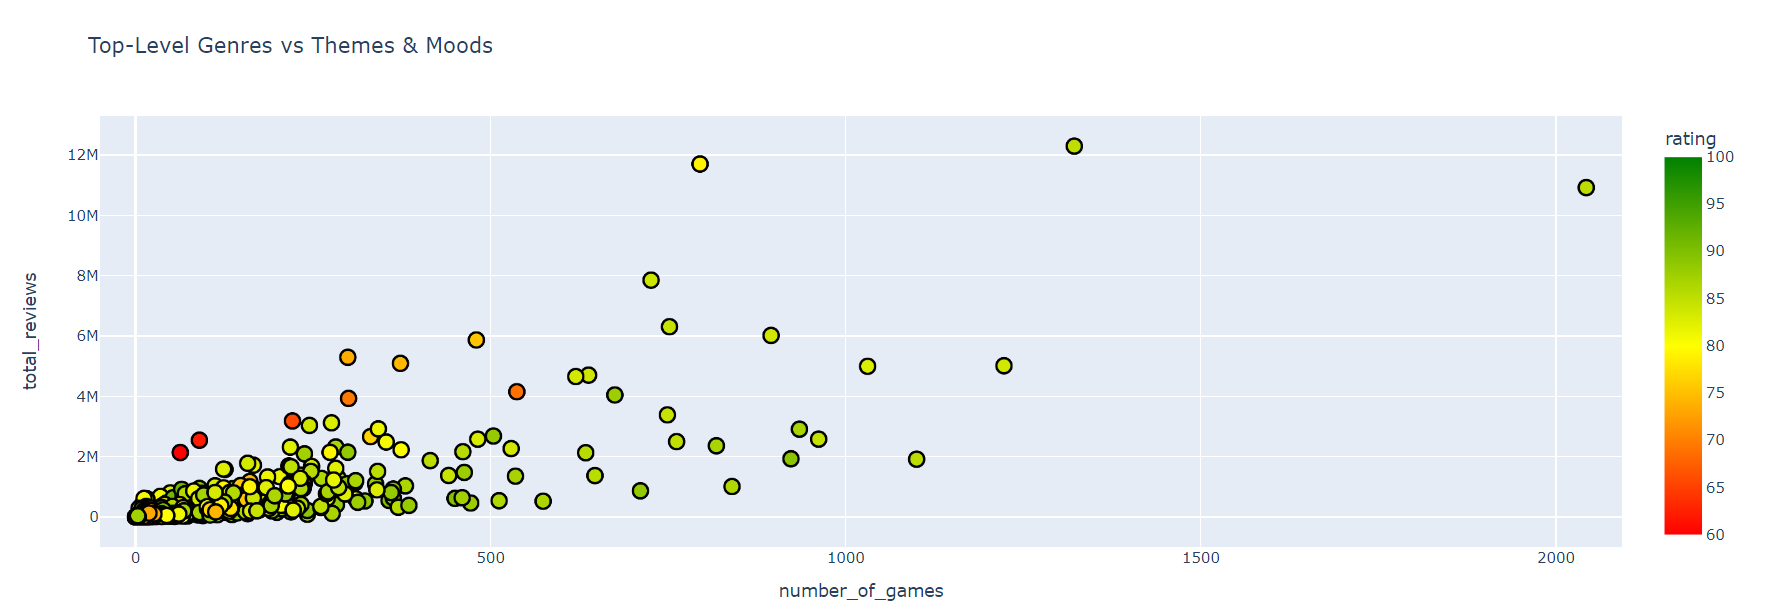
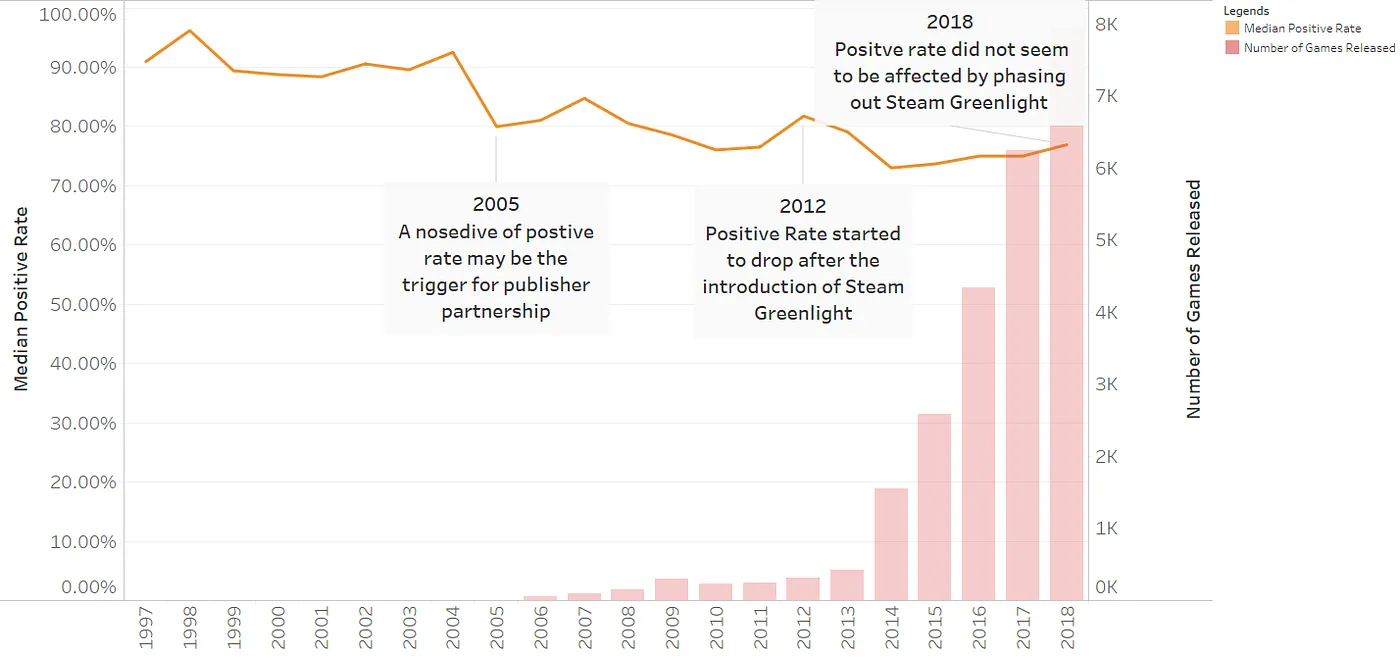
Storyboard Draft

The figures below are drafts for the proposed Shiny app.

Source Code
---
title: "Proposal: Exploring Trends in Video Games Distributed by Steam"
date: 12 February 2023
date-modified: "`r Sys.Date()`"
execute:
  warning: false
format: html
editor: visual
---

## πŸ“’ Introduction

![](images/image-762791765.png){fig-align="center" width="800"}

### Background

In 2021, the video game market was estimated to be **\$195.65 billion** and is expected to expand at a compound annual growth rate (CAGR) of 12.9% from 2022 to 2030. In comparison, One of the fastest growing categories is the digital PC games market which is estimated to grow from **\$10.86 billion** in 2022 to **\$12.67 billion in 2023** at a compound annual growth rate (CAGR) of 16.7%. The COVID-19 pandemic contributed to the industry's increased growth due to people being forced to remain indoors. This gave people the chance to explore more indoor activities, especially gaming. Several game developers also released their games for free online during this period.

**Steam** is a major digital game distribution platform run by the Valve Corporation. It was originally released in 2003 as a way for Valve release updates for their own developed games, but eventually evolved into a publisher for third-party games. The platform accounts for **75% of the global PC games market**. In 2020, Steam had **120 million active users per month**, averaging **62.6 million people use Steam every day**. This growth resulted in the number of hours spent playing games on Steam climbing by **50.7%** year over year, and game sales increased by nearly **21.4%**.

### Objective

The objective of the project is to **visualize the historical and current field of the online PC games**. Given that Steam already accounts for 75% of the PC games market, the dataset used will be focused on games in the Steam platform. **We aim to achieve insights by exploring the relationships between demand, pricing, tags and reviews.** This may be of help to any third party developers wanting to publish on Steam or anyone interested in investing into the video game industry to achieve an understanding.

## πŸ“š Related Works

### [Steam Data Analysis](https://duerkos.github.io/steam_analysis/ "Steam Data Analysis") by duerkos

![](images/image-1142086454.png){fig-align="center"}

This study focuses on the exploratory data analysis of game ratings or reviews and the different Steam tags such as genre, software requirements, themes and others. It also explores pricing trends and geographical factors. **Our study can build on some directions provided by author the and further improve on the visualizations displayed.**

### [**Exploratory Data Analysis on Steam Store Games Dataset**](https://aldenyuan.medium.com/exploratory-data-analysis-on-steam-store-games-dataset-f4ff06da44eb "Exploratory Data Analysis on Steam Store Games Dataset") **by Alden Yuan**

![](images/image-523766504.png)

This article delves into Steam store data in order to investigate on the quality of the games being released. It also explores the trends of popular games. **This can provide inspiration in terms of visualization methods and also in terms of possible angles of exploration.**

## πŸ“ Data

### Data Source

The data to be used was acquired from [Kaggle](https://www.kaggle.com/datasets/vicentearce/steam-and-steam-spy-raw-datasets?select=steamspy_data.csv "Steam and Steam Spy raw datasets") updated last 2022. It is comprised of two datasets namely, *steamspy_data.csv* and *steam_app_data.csv* which will be used in this proposed study and Shiny app.

### Data Composition

Using the `glimpse()` function of the **`dplyr`** package, the following figures contain the columns and sample values for the mentioned datasets.

```{r}
#| echo: false
#| eval: false
pacman::p_load(tidyverse)

steam_app <- read_csv("data/steam_app_data.csv")
steamspy <- read_csv("data/steamspy_data.csv")
```

#### steam_app_data.csv

![](images/image-53703101.png){.glimpse}

#### steamspy_data.csv

![](images/image-1573838313.png){.glimpse}

::: {.callout-note icon="false"}
## πŸ–ŠοΈ NOTE!

The column information provided above are from the raw datasets. Further data wrangling and extraction will be performed in the process of the study and Shiny app creation. For example, the labels in the 'tags' column need to be extracted from the its original string. Another thing to address is the all null values in several other columns.
:::

## πŸ“‹ Methodology

### Packages

The following packages are required to perform the visualizations in the next section.

-   **`tidyverse`** - A collection of R packages designed for data science

-   **`ggtatsplot`** - An extension of ggplot2 package for creating graphics with details from statistical tests included in the plots

-   **`plotly`** - To build interactive graph

-   **`GGally`** -- An extension to ggplot2 package by adding several functions to reduce the complexity of combining geoms with transformed data

-   **`ggdist`** - is an R package that provides a flexible set of ggplot2 geoms and stats designed especially for visualising distributions and uncertainty.

### Visualizations

The following visual analytics methods will be applied for analysis in our study and Shiny app.

#### Descriptive Analysis

-   Interactive bar and histogram plots

-   Interactive combined line-scatter-box plot

-   Parallel coordinates plot

#### Statistical Analysis

-   Error bar plot

-   Interactive correlogram

-   ANOVA Test plot

#### Predictive Analysis

-   Linear regression plot with prediction interval

-   Regression plot *(if time permits)*

### Storyboard Draft

The figures below are drafts for the proposed Shiny app.

![](images/image-703878195.png){fig-align="center"}

![](images/image-309878857.png){fig-align="center"}

![](images/image-661351596.png){fig-align="center"}

![](images/image-1159462659.png){fig-align="center"}